


Is Now a Good Time to Buy Property in Dubai? (Market update — June 2026)
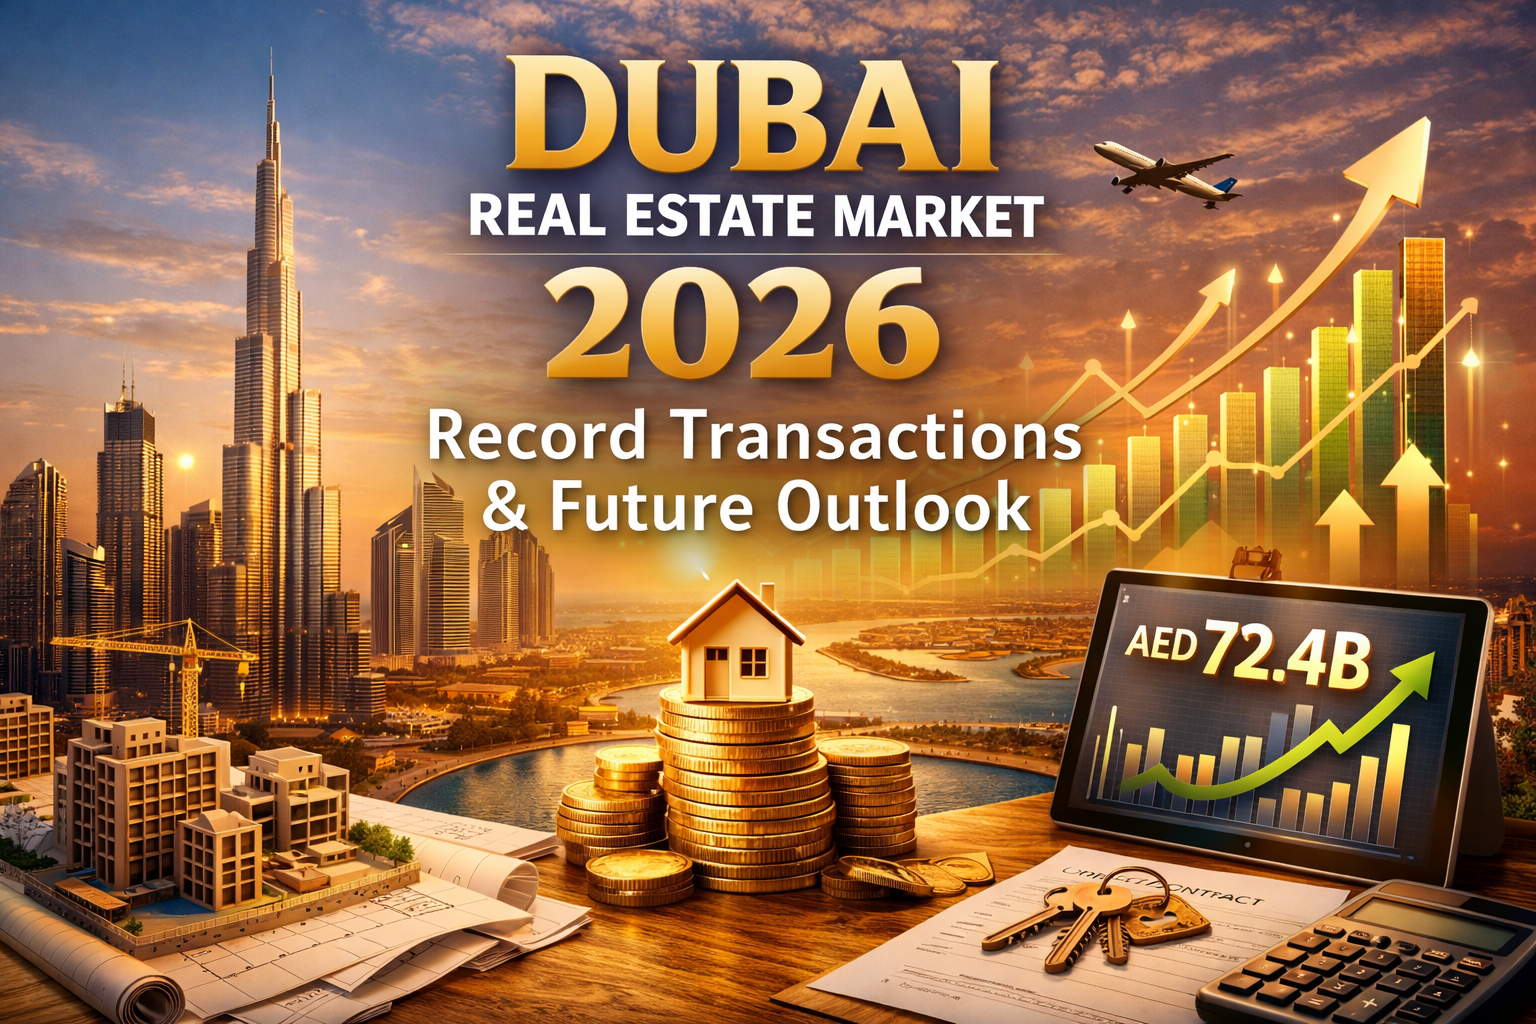
Dubai’s residential market continues to draw global attention in 2026. Headlines cite record transaction values and strong demand in both prime and mainstream segments, but underlying data show variation by product type and community. This article condenses the latest official and market-research figures, highlights practical opportunities and risks, and gives clear next steps for prospective buyers and investors.
Quick market snapshot — headline numbers
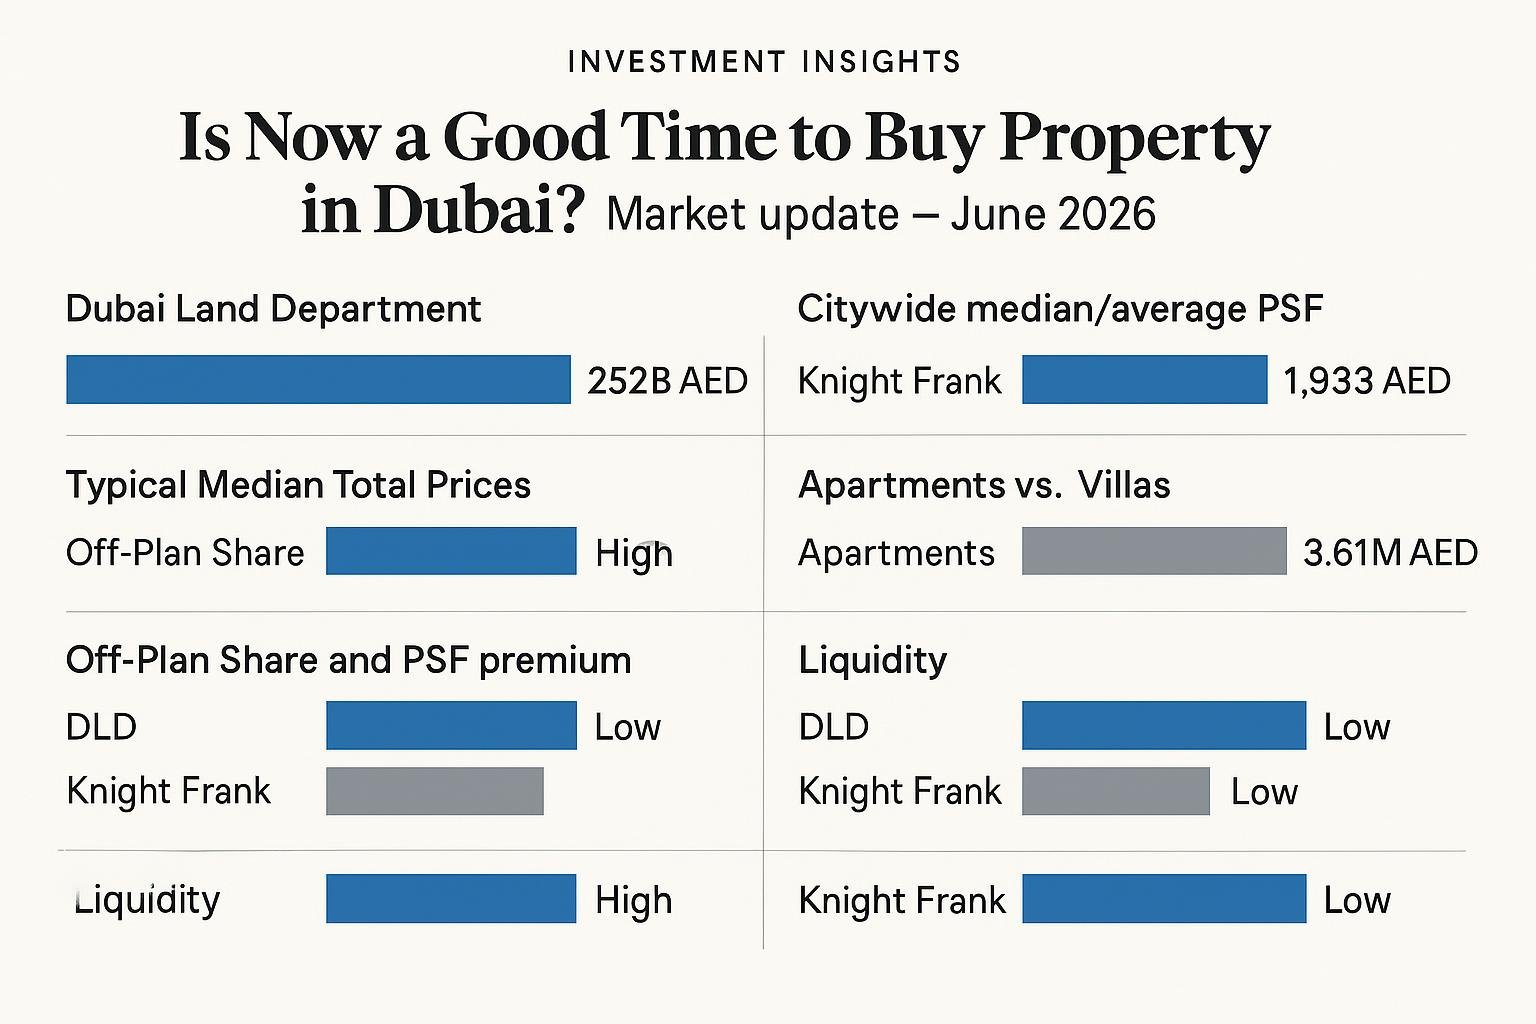
- Dubai Land Department reported AED 252 billion in total real-estate transaction value in Q1 2026 (this figure covers all recorded procedures, not just completed residential sales). (dubailand.gov.ae)
- Residential sales value (sales-only) during Q1 2026 was reported by Knight Frank at around AED 137.3 billion across c.45,200 sales. Citywide average price per sq.ft in that dataset was ~AED 1,933 in Q1 2026. (knightfrank.ae)
- DXB Analytics’ DLD-based analysis reports a median residential price per sq.ft of ~1,692 AED for calendar 2025 and early-2026 series; the 2026 YTD median rises above that in early months (DXB’s Jan–Feb 2026 series notes ~1,818 AED/sq.ft YTD). Typical median prices: apartment ~1.30M AED; villa ~3.61M AED. (dxbanalytics.com)
- The off-plan segment remains dominant: off-plan accounted for roughly 63–72% of transactions depending on the dataset and period, and typically trades at a per-sq.ft premium versus ready stock. (knightfrank.ae)
What the data actually says (demand, prices, supply)
Two consistent themes emerge across reputable sources: high activity and segmentation. Official DLD procedures show very large nominal activity (AED 252bn in Q1 2026), reflecting strong money flows into Dubai real estate, including large-ticket deals and land transactions. (dubailand.gov.ae) Knight Frank and market analysts that focus on declared sales show a slightly different lens: Q1 residential sales (sales-only) were sizeable but smaller than the headline DLD aggregate, because DLD totals include mortgages, transfers, and other procedures. (knightfrank.ae)
Pricing trends have been positive since 2020, though growth rates are moderating from peak years. DXB Analytics reports median PSF rising from ~935 AED in 2020 to roughly 1,692 AED in 2025 (and early-2026 series shows further elevation). Knight Frank’s citywide PSF for Q1 2026 sits higher in its sample (c. AED 1,933/psf) because of differing sample definitions and the inclusion of higher-priced prime inventory. Expect differences between data providers — they use different filters (sales-only vs all procedures; median vs mean; inclusion of ultra-prime communities). (dxbanalytics.com)
Supply and product mix matter: off-plan transactions represent the majority of volume in recent periods, giving developers pricing power where product/locations match buyer demand. At the same time, areas with substantial near-term delivery can see localized price pressures. Knight Frank lists large developer pipelines concentrated in several masterplans, which underlines why community-level analysis matters when deciding to buy. (knightfrank.ae)
Where to focus: segments, communities and yields
Segment differences are meaningful for purchase intent:
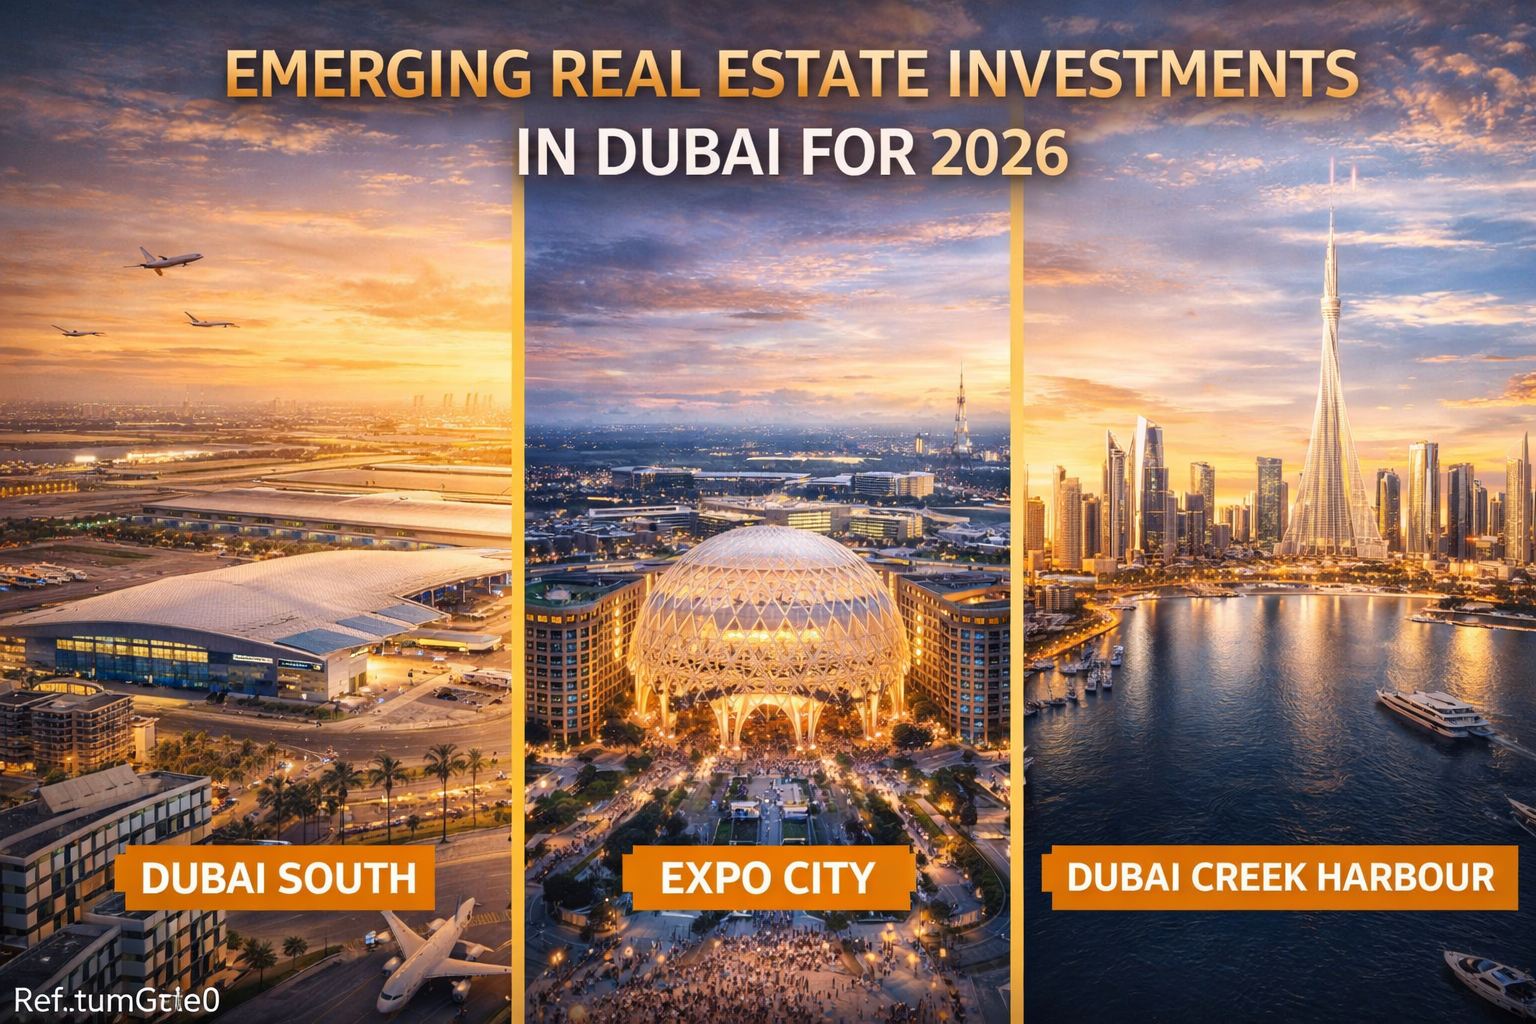
- Entry/mainstream apartments: higher liquidity, many communities with sub‑million-AED typical apartment prices in the lower-cost pockets; median PSF varies widely by community. DXB shows JVC, Dubai South and several suburban clusters among the most active by volume. (dxbanalytics.com)
- Villas and townhouses: larger total values, lower PSF on average but higher total ticket size — attractive to owner-occupiers and long-term investors in certain masterplans. (dxbanalytics.com)
- Prime/ultra-prime: Dubai continues to see strong ultra‑prime demand (notable increase in >AED10m deals during Q1 2026), which lifts headline value figures but is less representative of mass-market liquidity. (emiratesnbdresearch.com)
Rental returns remain an important yield consideration. Market analyses show gross yields typically range from roughly 5–9% gross depending on area, with more affordable communities often delivering the higher top-end yields and prime locations lower yields but stronger capital-performance potential. Always test gross and net yield scenarios against financing costs and fees for a realistic cash-flow view. (dxbanalytics.com)
Data comparison table — compact view
| Metric | Official / DLD (Q1 2026) | Knight Frank (Q1 2026, residential focus) | DXB Analytics (median / 2025–early 2026) |
|---|---|---|---|
| Total reported value (Q1) | AED 252 billion (all DLD real‑estate procedures). (dubailand.gov.ae) | AED 137.3 billion (residential sales value, Q1). (knightfrank.ae) | NA (DXB provides sales counts and medians rather than single aggregate value). (dxbanalytics.com) |
| Median / average PSF (citywide) | — | Approx. AED 1,933 psf (Knight Frank Q1 citywide series). (knightfrank.ae) | Median residential PSF 2025: 1,692 AED; 2026 YTD early series ~1,818 AED/psf. Typical apartment ~1,729 psf. (dxbanalytics.com) |
| Typical total price | — | — | Typical apartment ~1.30M AED; typical villa ~3.61M AED (DXB median totals). (dxbanalytics.com) |
| Off‑plan share | Included in DLD totals (high off‑plan activity noted across Q1). (dubailand.gov.ae) | Off‑plan ~72% of transactions in Q1 (Knight Frank sample). (knightfrank.ae) | Off‑plan ~63% of sales in 2025 (DXB analysis). Off‑plan typically trades at a PSF premium vs ready. (dxbanalytics.com) |
| Transactions / liquidity | DLD: hundreds of thousands of procedures recorded (718,160 procedures in Q1 per DLD release). (dubailand.gov.ae) | KF: ~45,200 residential transfers in Q1 2026. (knightfrank.ae) | DXB: 215,060 sales in 2025 (annual figure), monthly averages ~17,900 in 2025. (dxbanalytics.com) |
Market Data Comparison / Data Snapshot
- Large headline flows: DLD Q1 2026 = AED 252bn (all procedures) — this signals significant capital but includes a broad set of transactions beyond pure residential sales. (dubailand.gov.ae)
- Residential sales value (sales-only view) ~AED 137.3bn in Q1 per Knight Frank; residential unit transfers ~45k in Q1 per market research. (knightfrank.ae)
- Median PSF differs by methodology: DXB (median-based) ~1,692 AED (2025), trending higher in early 2026; Knight Frank (citywide sample) ~1,933 AED in Q1. Use the provider whose sample fits your target community. (dxbanalytics.com)
- Practical implication: if you’re targeting mainstream liquidity markets (e.g., JVC, Dubai South), focus on DXB/area medians; if targeting prime inventory, use prime‑market series (Knight Frank, Knight Frank Prime indices). (dxbanalytics.com)
Practical next steps — how to act (buyers and investors)
- Define objective clearly: owner-occupier, medium-term hold (3–5 years), or yield investor. Each objective points to different communities and budgets.
- Use community-level data: compare median PSF, transaction counts, and recent liquidity for your target communities (DXB Analytics and Knight Frank community tables are good starting points). (dxbanalytics.com)
- Check supply pipeline: confirm expected handover volumes in the community — large near-term handovers can affect resale/rental pricing. Knight Frank and developer pipeline notes list top community pipelines. (knightfrank.ae)
- Model financing and net yield: calculate gross and net yield after service charges, finance cost, agent fees and vacancy assumptions. Banks in the UAE publish mortgage rules; get pre‑approval before serious offers.
- Inspect comparable completed sales and ask for sale contracts; for off‑plan, review payment schedule, developer track record, escrow arrangements and post‑handover service/management plan.
- Get professional advice: local lawyer for title and contract review, licensed broker for market comparables, and an independent valuer if you need an objective valuation for bank finance or portfolio decisions.
FAQ
Q: Is now a good time to buy property in Dubai?
A: The short answer is: it depends on your objectives. Market-wide indicators show elevated activity and higher headline values (DLD Q1 2026 totals and strong residential sales), while median-based measures show healthy but moderating growth. If your strategy is long-term ownership in a liquid community, the market fundamentals remain supportive; if you need a short-term flip, be selective and focus on liquidity and micro-market signals. (dubailand.gov.ae)
Q: Are prices likely to fall sharply in 2026?
A: Leading datasets project moderation rather than a broad collapse. Year-on-year growth has slowed from the 2022 peak but remained positive through early 2026. Localised corrections are possible in oversupplied submarkets. Continue to monitor area-level supply and monthly transaction trends. (dxbanalytics.com)
Q: What return/yield can I expect?
A: Gross rental yields typically range from about 5% in premium pockets to near 8–9% in more affordable communities, depending on unit type and management costs. Always model net yields after all costs. (dxbanalytics.com)
Q: Where should I start my search?
A: Start by defining budget and intent, then shortlist 3–5 communities with recent transaction volumes and median PSF in your range. Use DXB community tools or agency community reports to compare liquidity, typical rents, and recent trades. Visit units where possible and verify all developer documentation if buying off‑plan. (dxbanalytics.com)
Closing thought
Dubai in 2026 remains a dynamic and capital-attractive market. The data show strong headline flows and continued buyer interest across segments, with a maturing pricing environment that requires community-level analysis. For buyers: be clear about your horizon, model realistic yields and costs, and use reliable community-level data and professional advice before committing.
Questions about a specific budget, community or transaction scenario? Tell us your objective and target areas and we’ll prepare a focused, data-driven shortlist and valuation checklist.
Want help with this Dubai property question?
Share your goal, budget, and preferred area. Real Dubai Deals can help you understand the next practical step.